Filtering your view
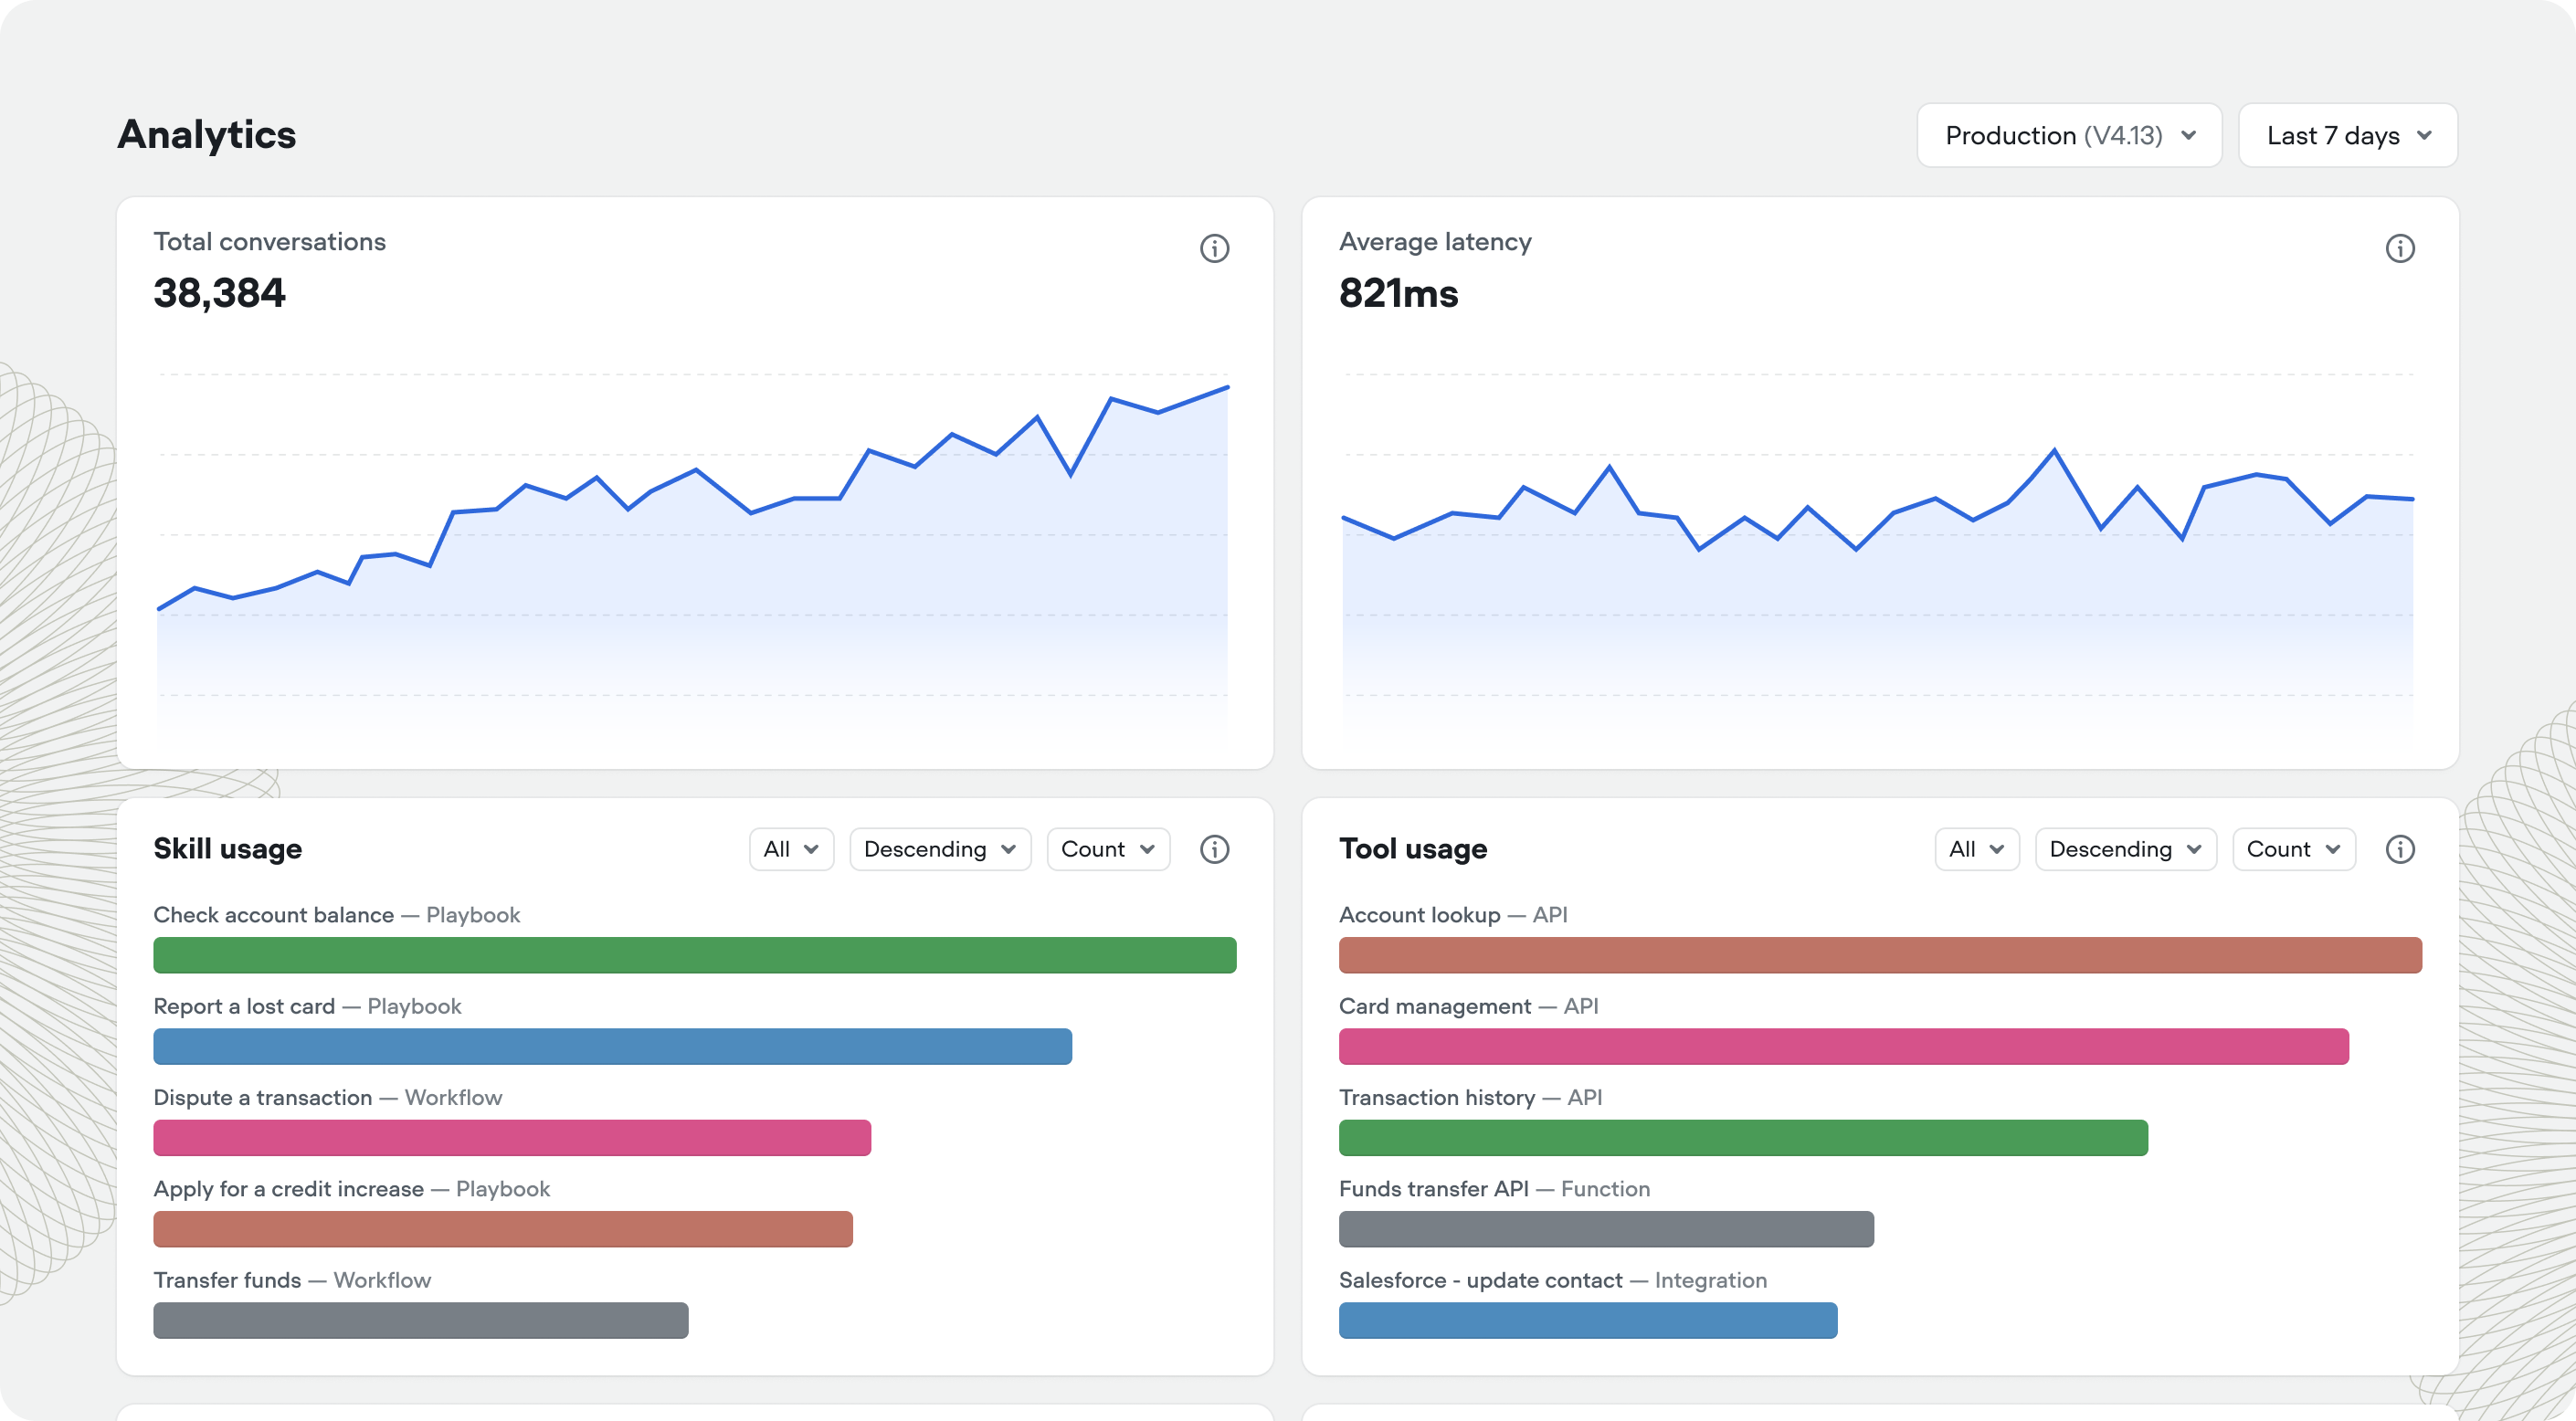
Use the controls at the top right to filter the data displayed across all widgets. The Environment dropdown lets you view metrics across all environments in the project or focus on a specific one. The Date range picker controls the time period for all charts and metrics.Customizing the dashboard
Click the settings icon to choose which widgets appear on your dashboard. Available metrics include:- Resolution rate, Customer satisfaction, Deflection rate, and any other enabled evaluations
- Total chats, Total interactions, and Unique users
- Latency monitoring and Credits usage
- Playbooks usage, Tools usage, and KB documents usage