Understanding the transcripts table
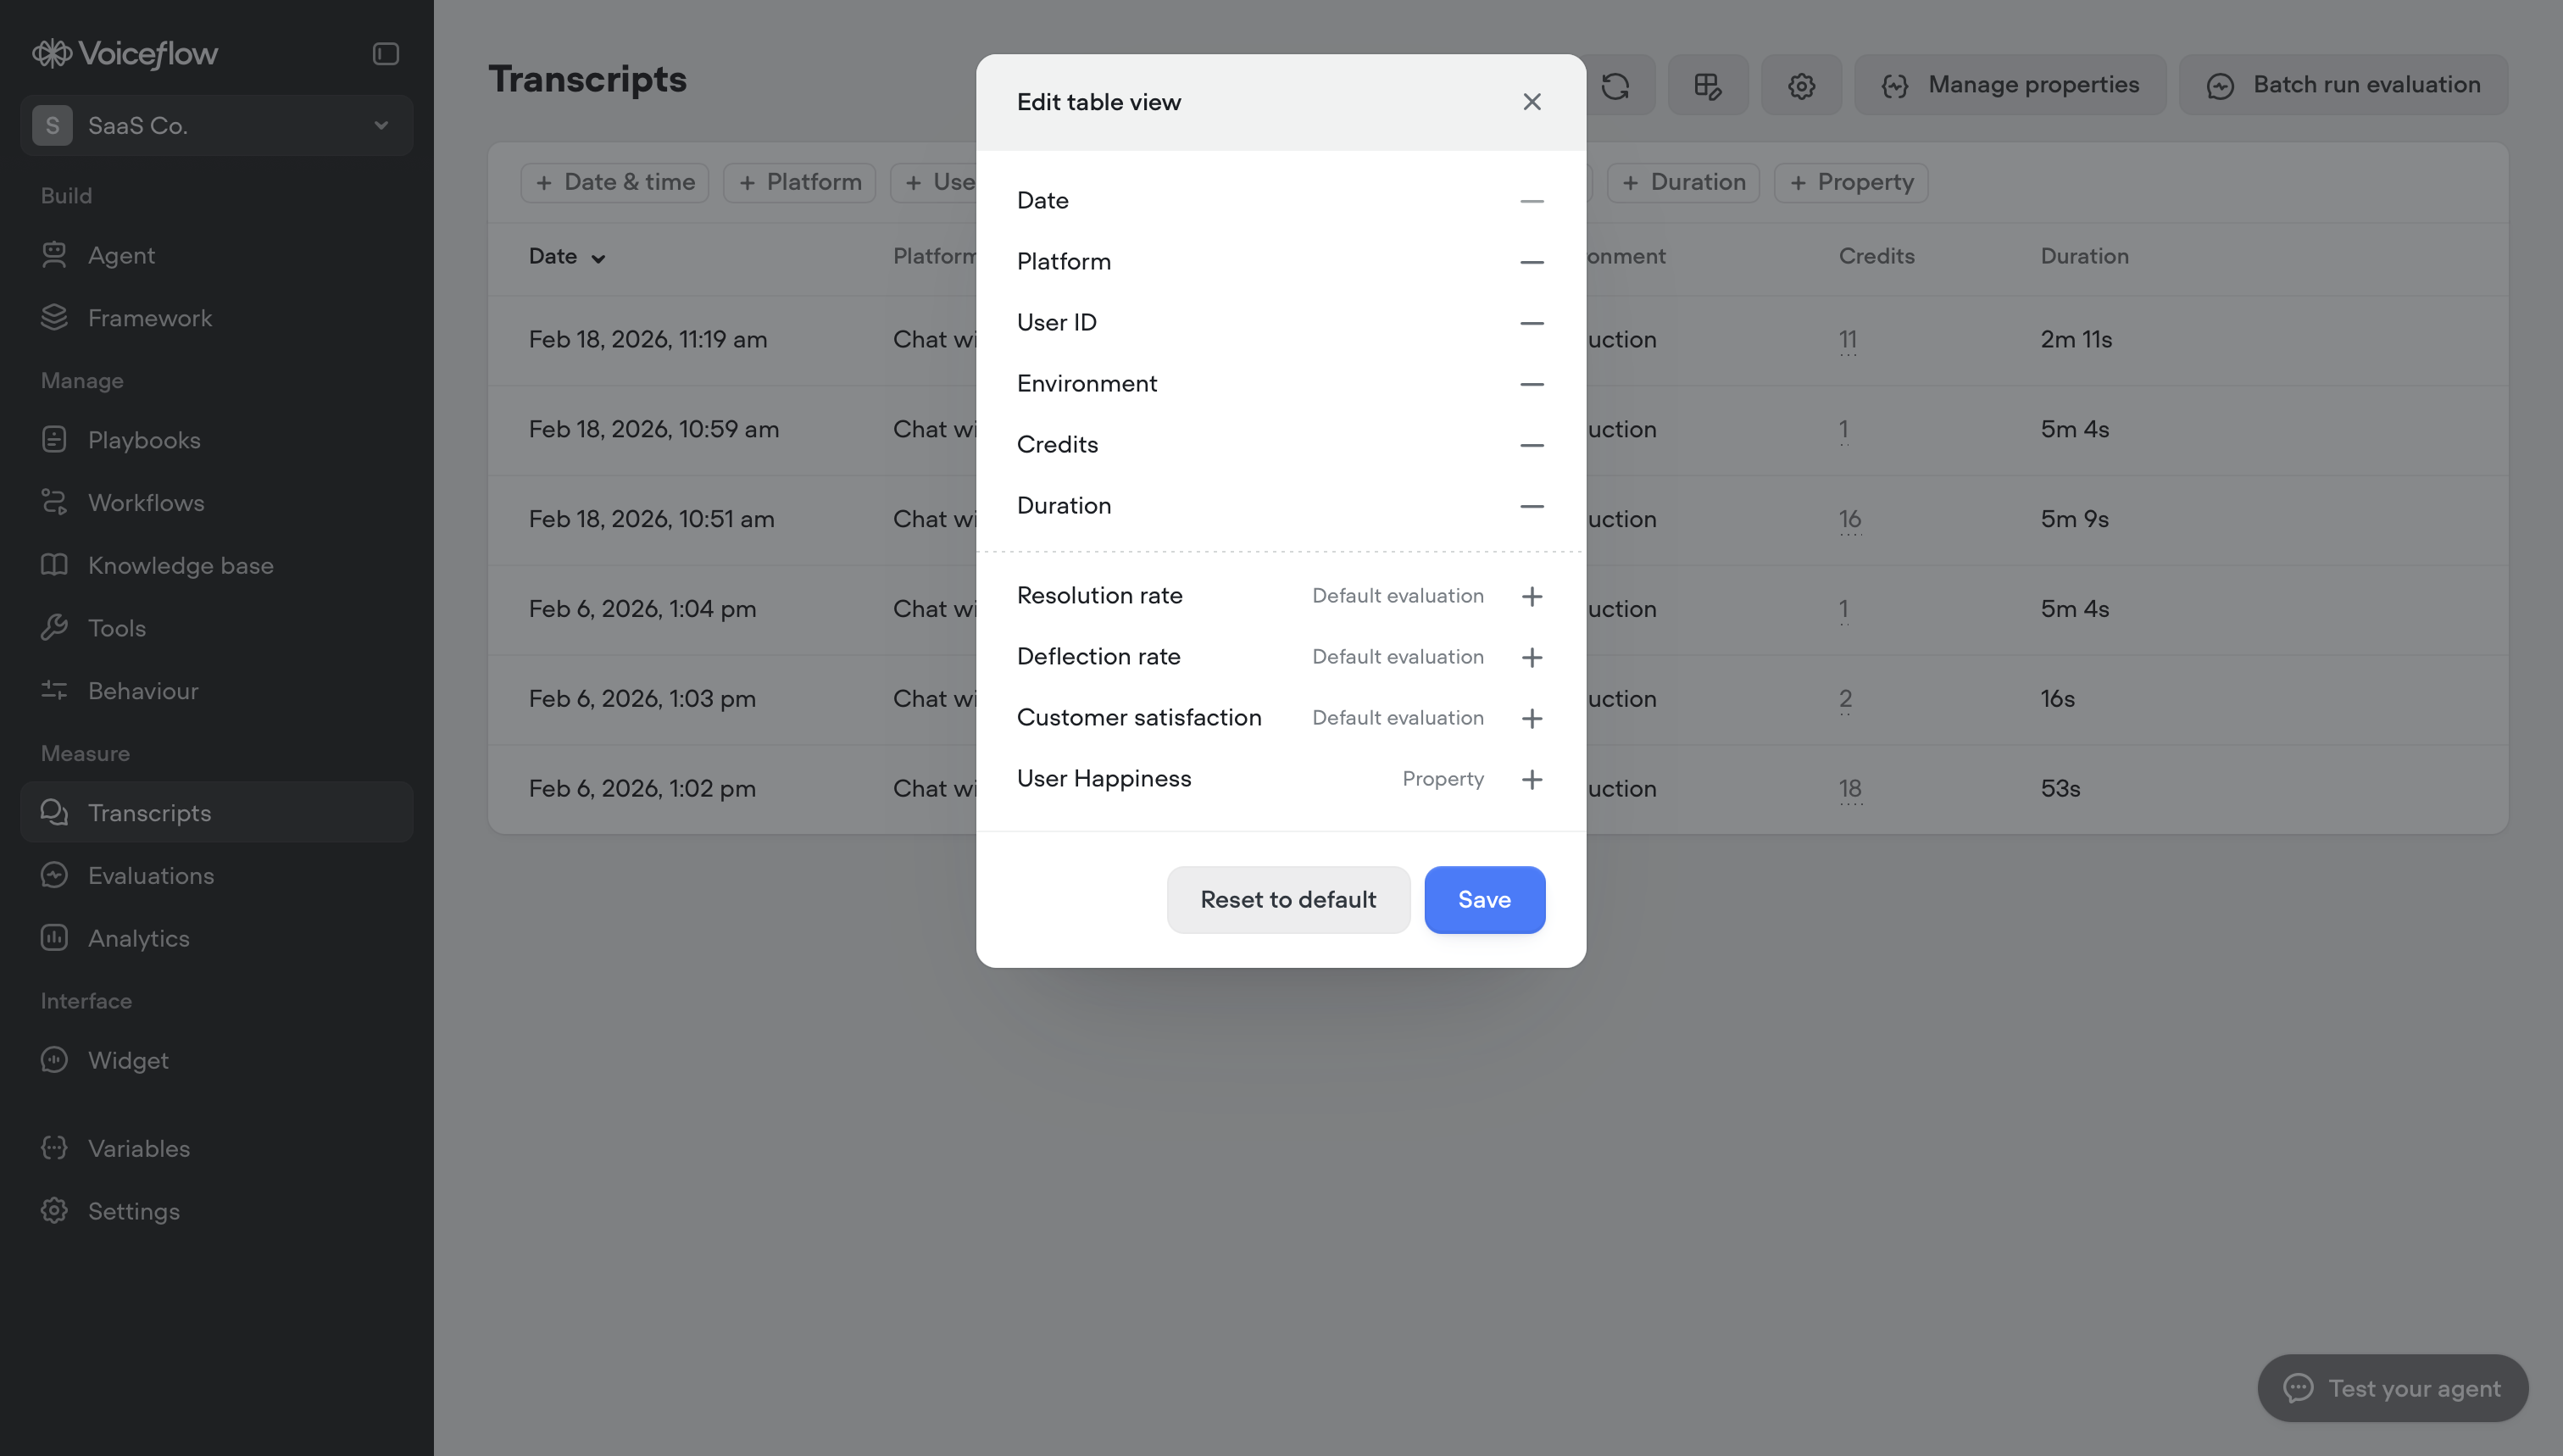
The transcripts table displays key information about each conversation at a glance. By default, you’ll see the date, platform, user ID, environment, credits consumed, and duration. You can customize which columns appear by clicking the table settings icon and adding or removing fields. Evaluation results can also be displayed as columns, letting you quickly scan conversation quality metrics like customer satisfaction or resolution rate directly from the table view.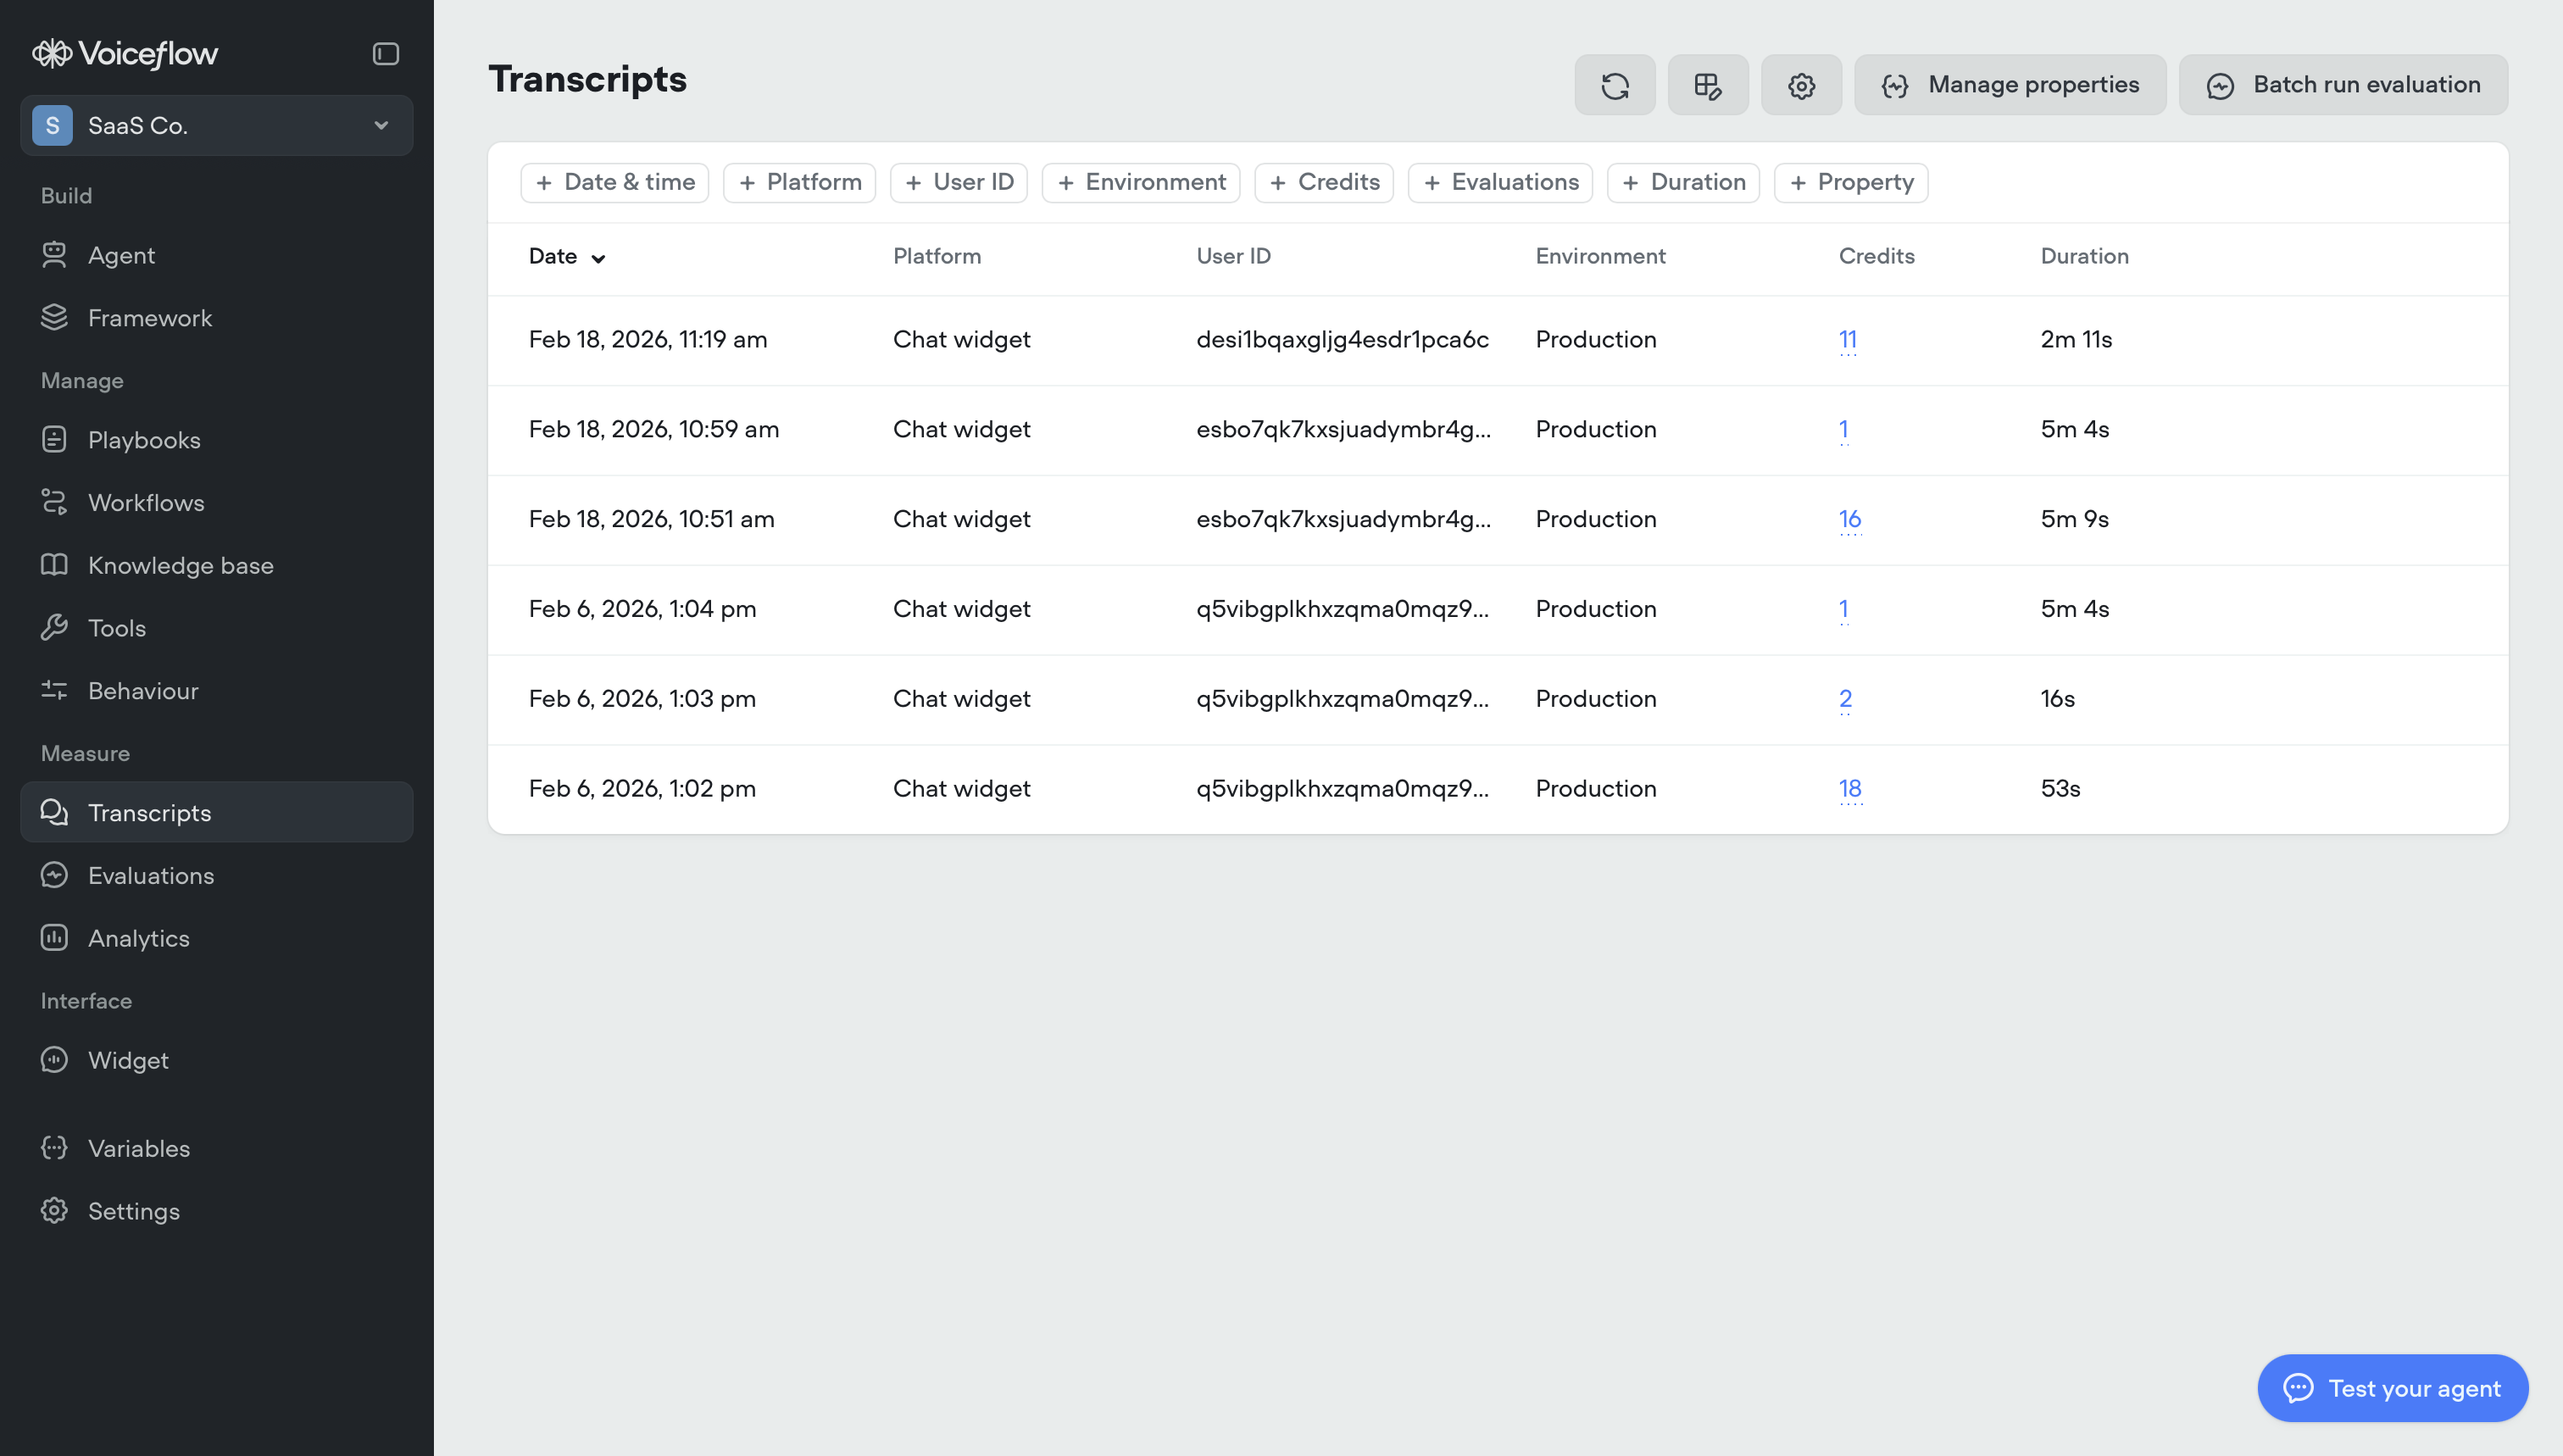
Filtering transcripts
Use the filter chips at the top of the table to narrow down your view. You can filter by date range, platform, user ID, environment, credits consumed, duration, evaluation results, or custom properties. Filters help you focus on specific conversation types, such as high-cost interactions or conversations with low satisfaction scores.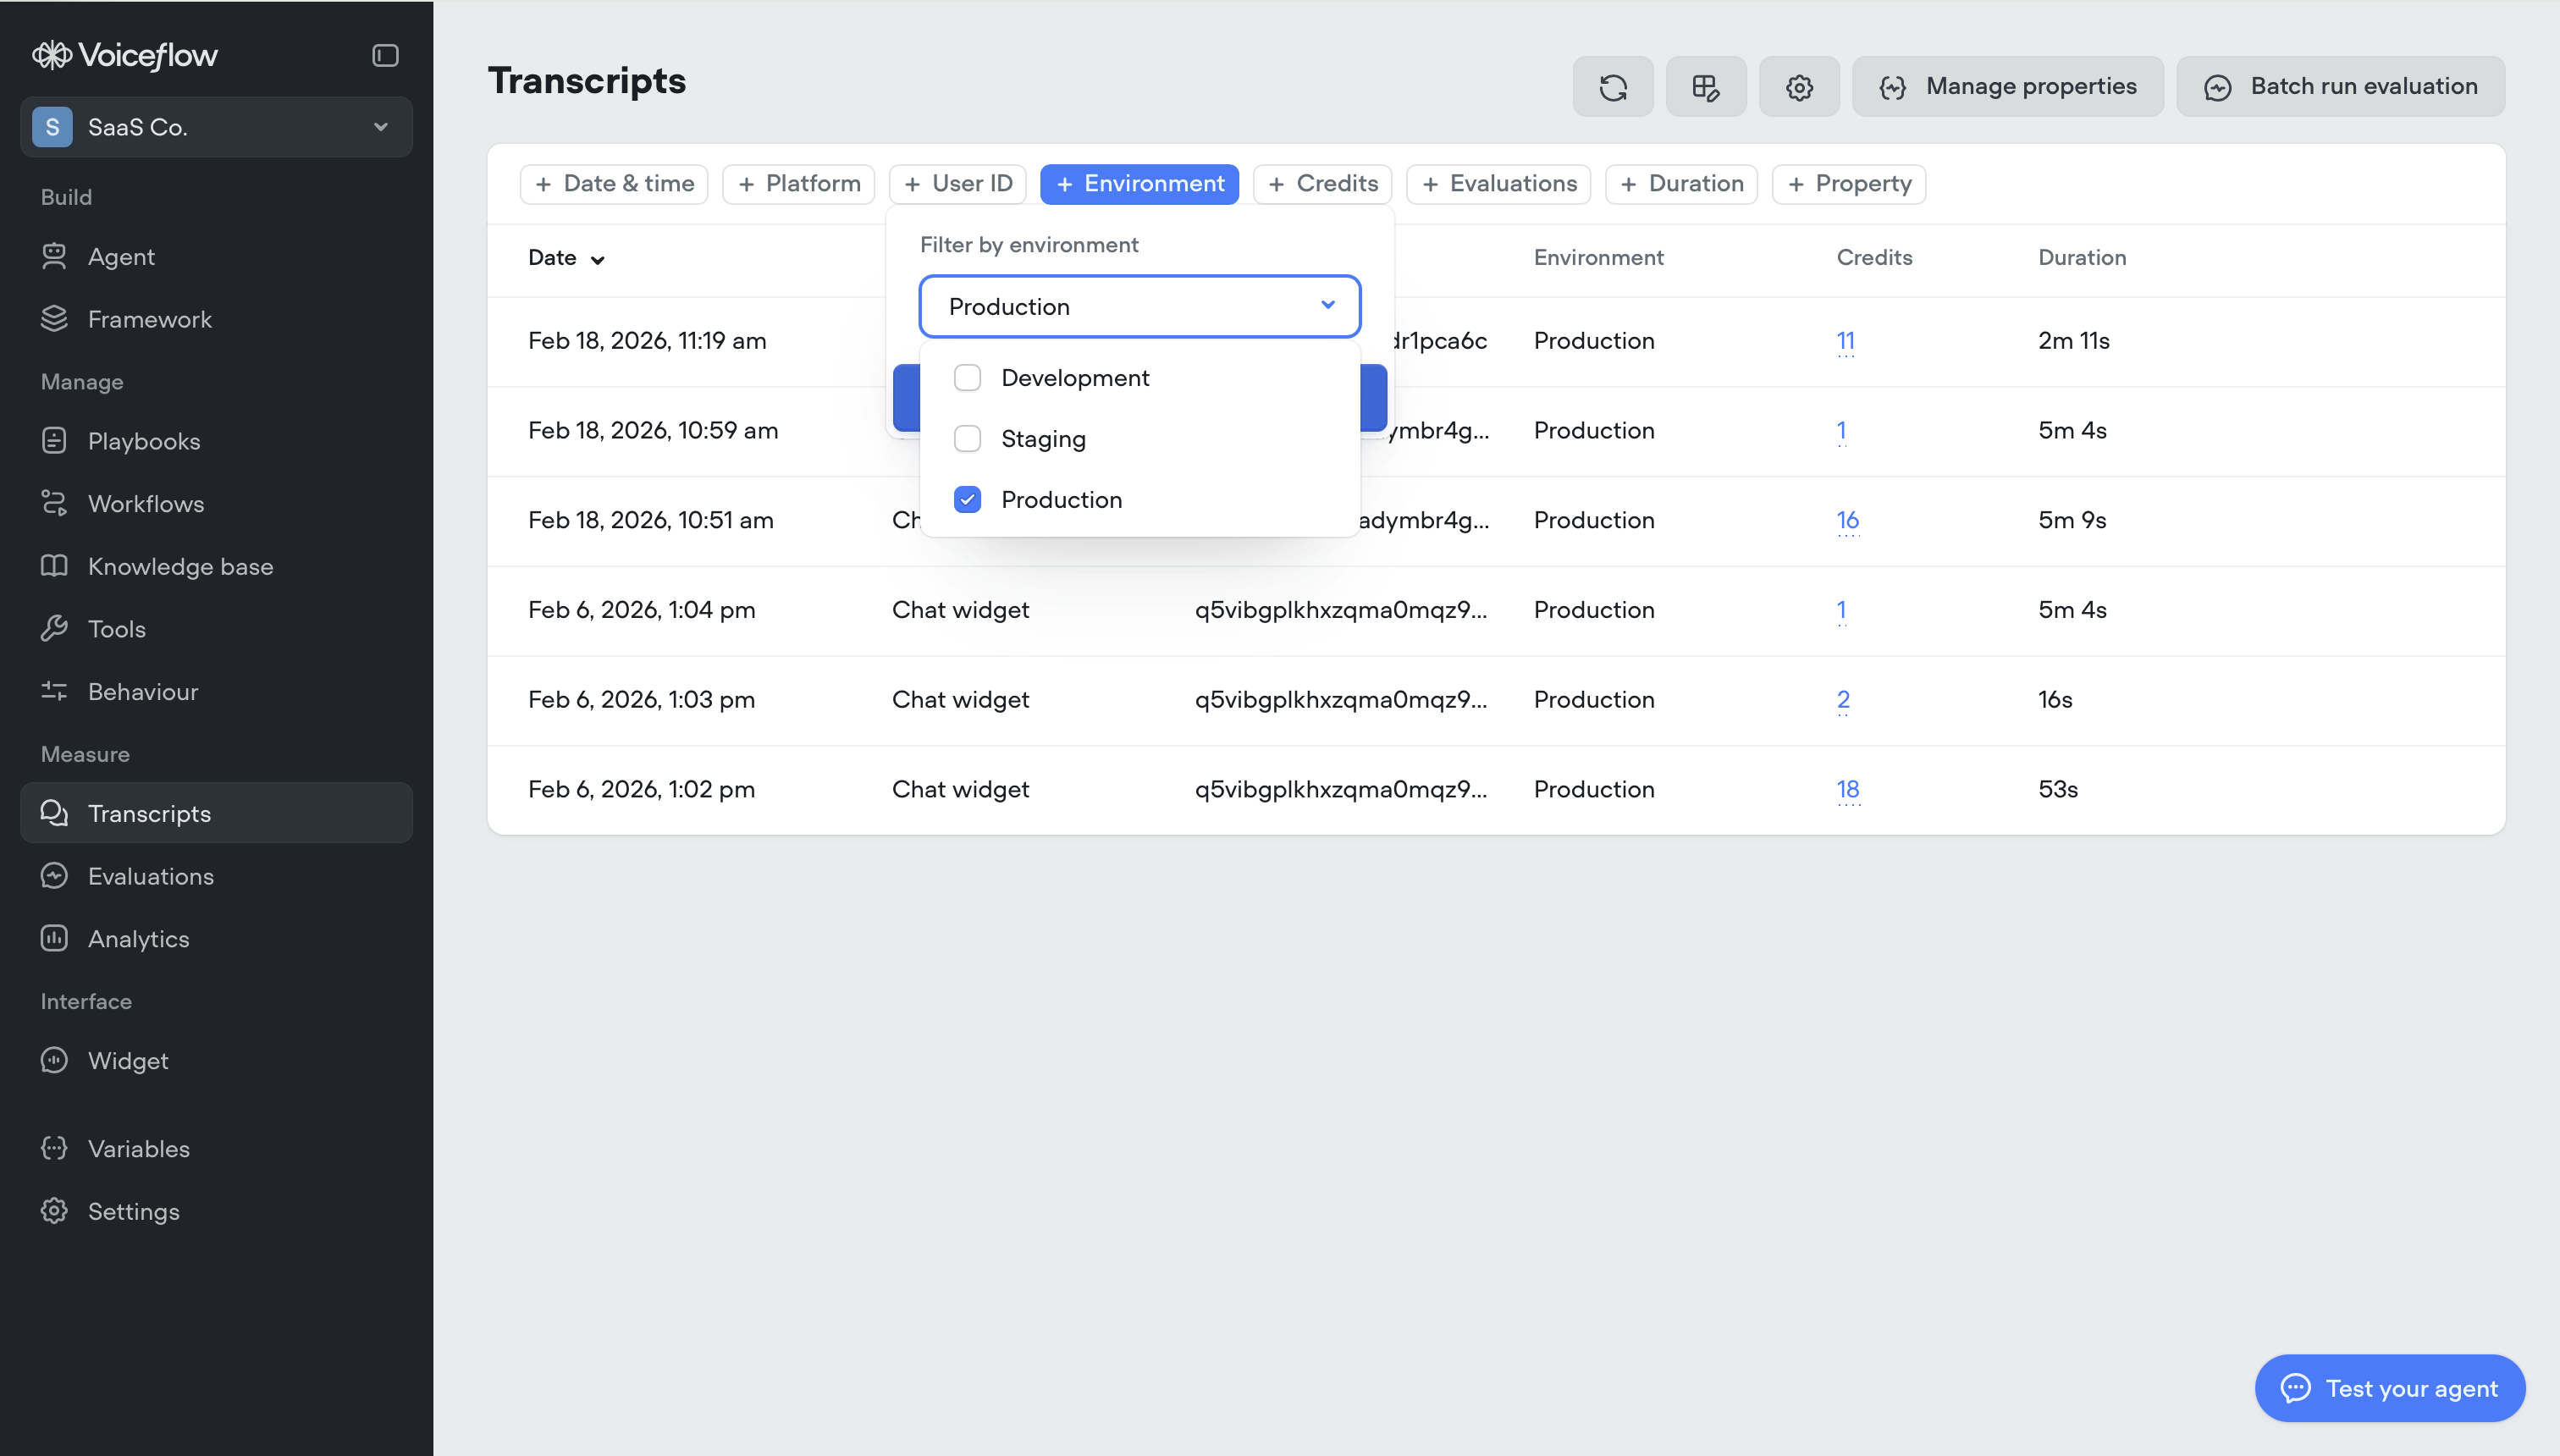
Reviewing individual transcripts
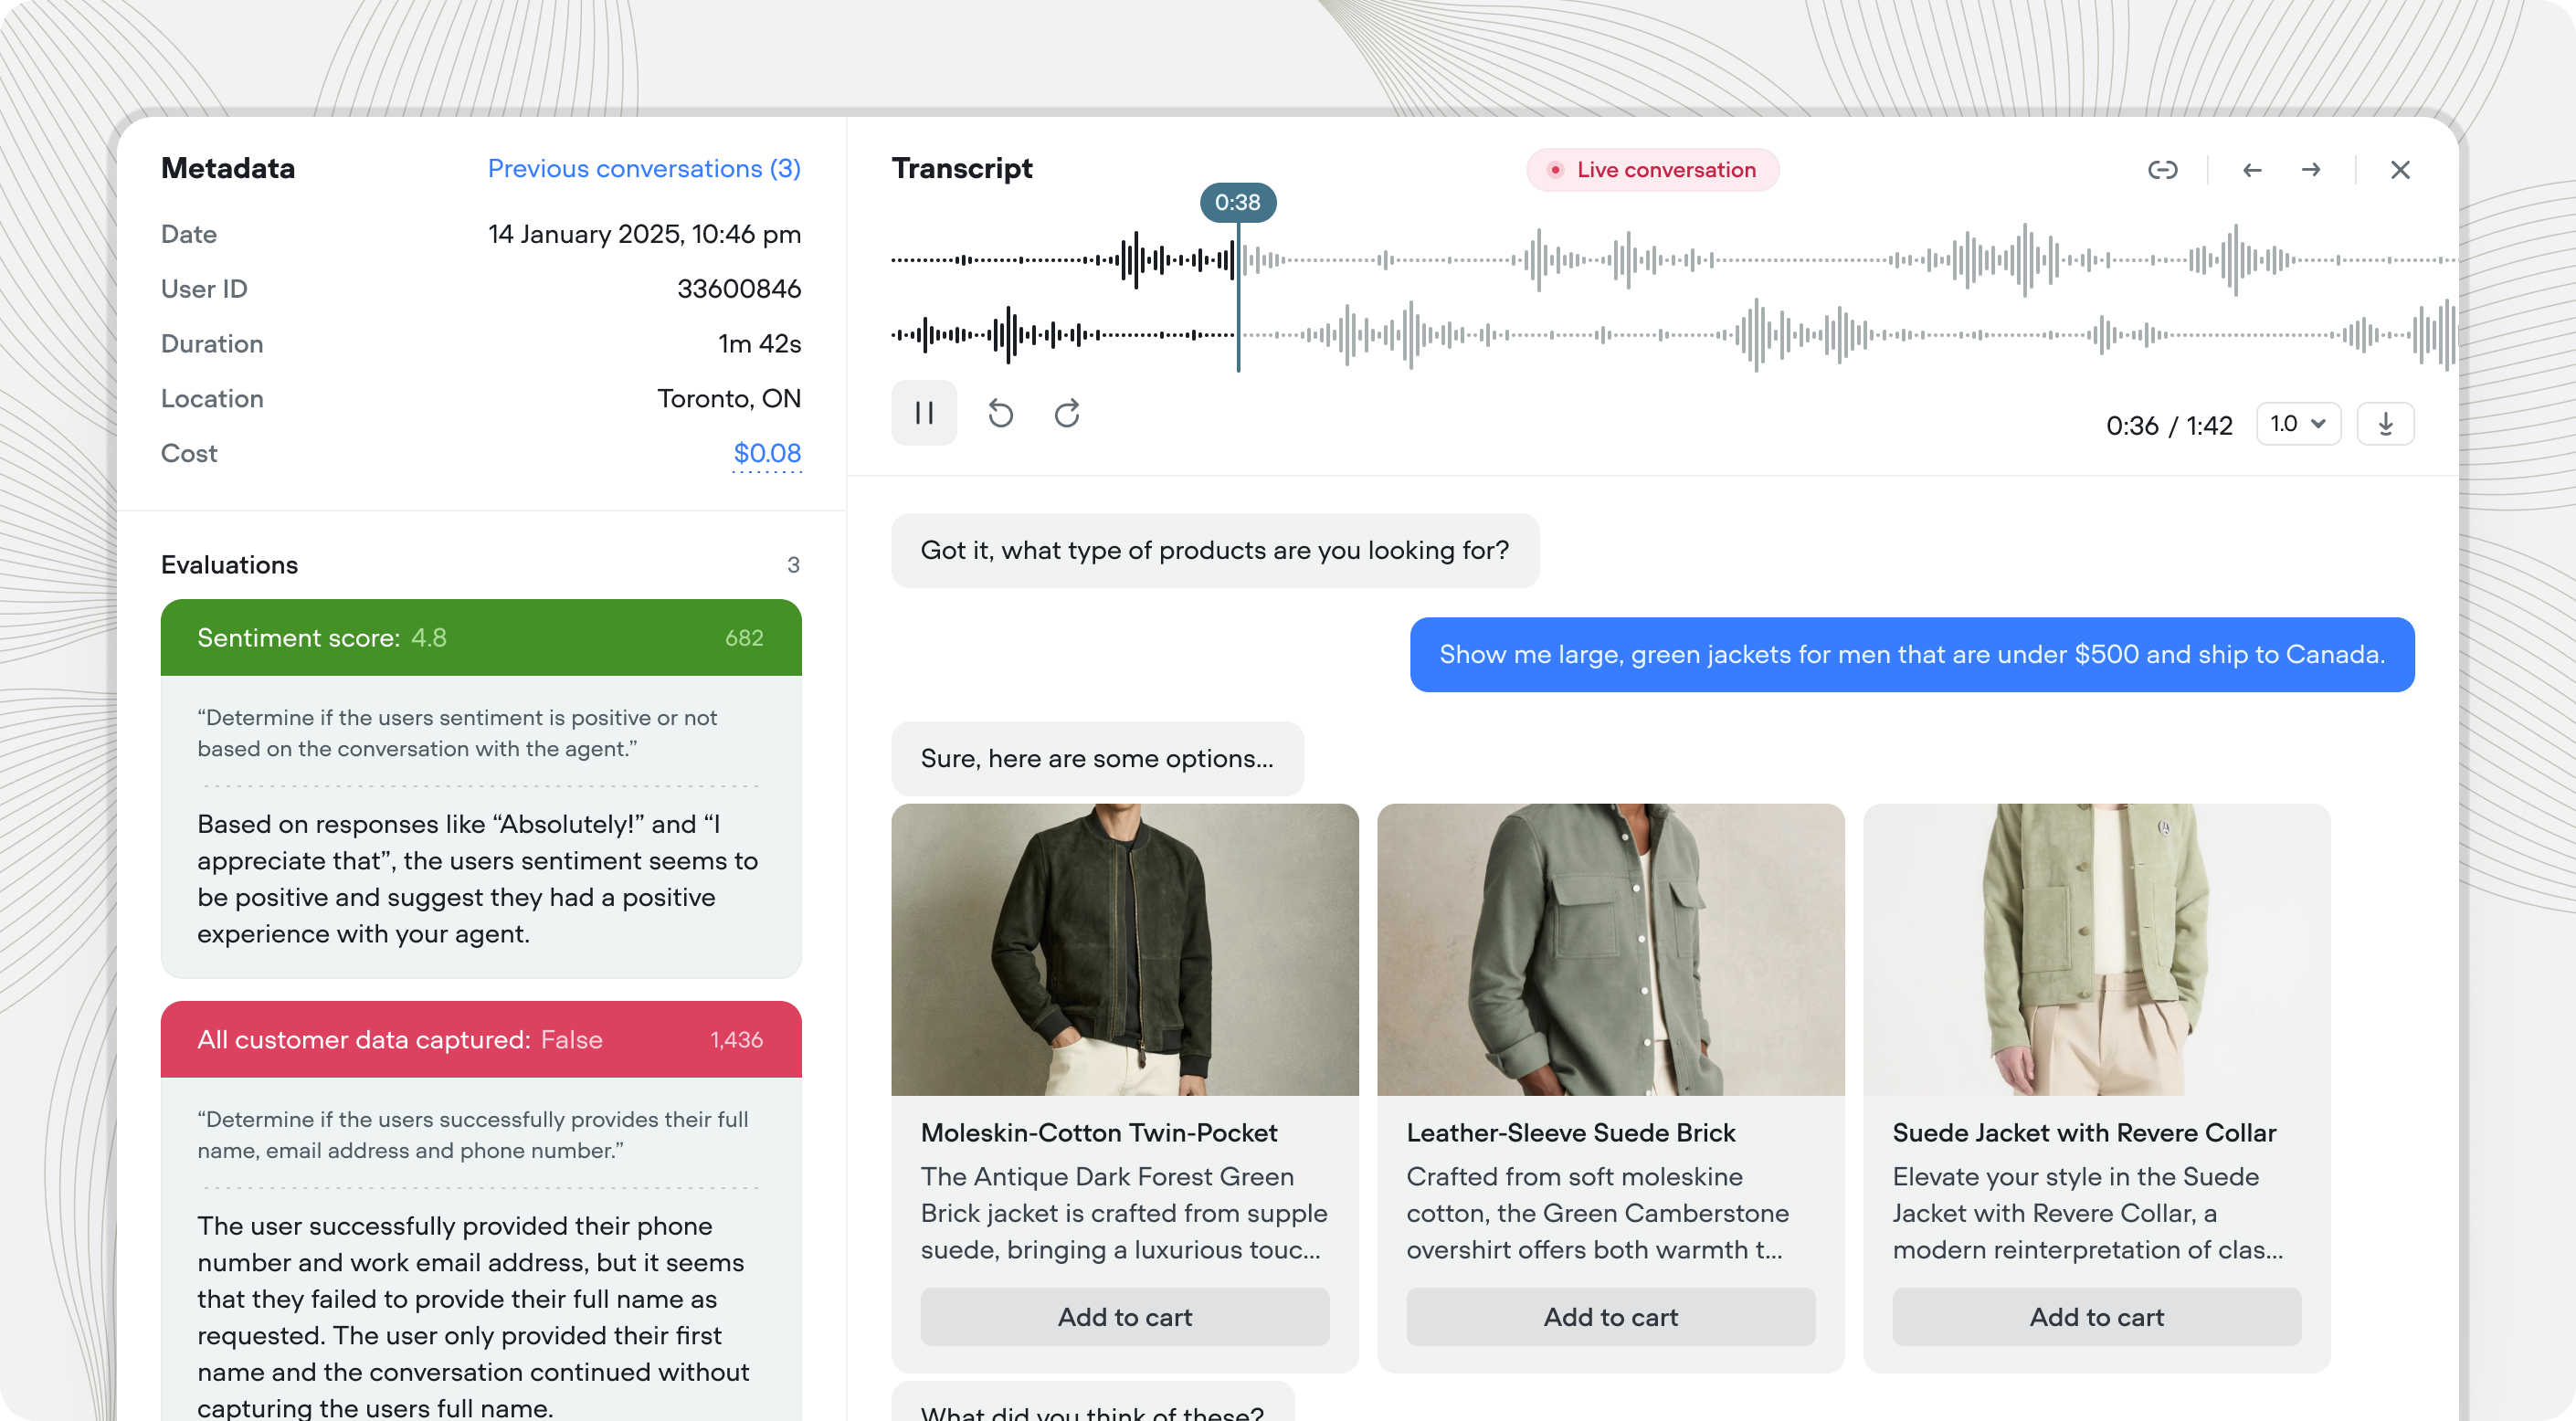
Click any transcript to open the detailed view. The full conversation appears on the right, with metadata and evaluation results on the left.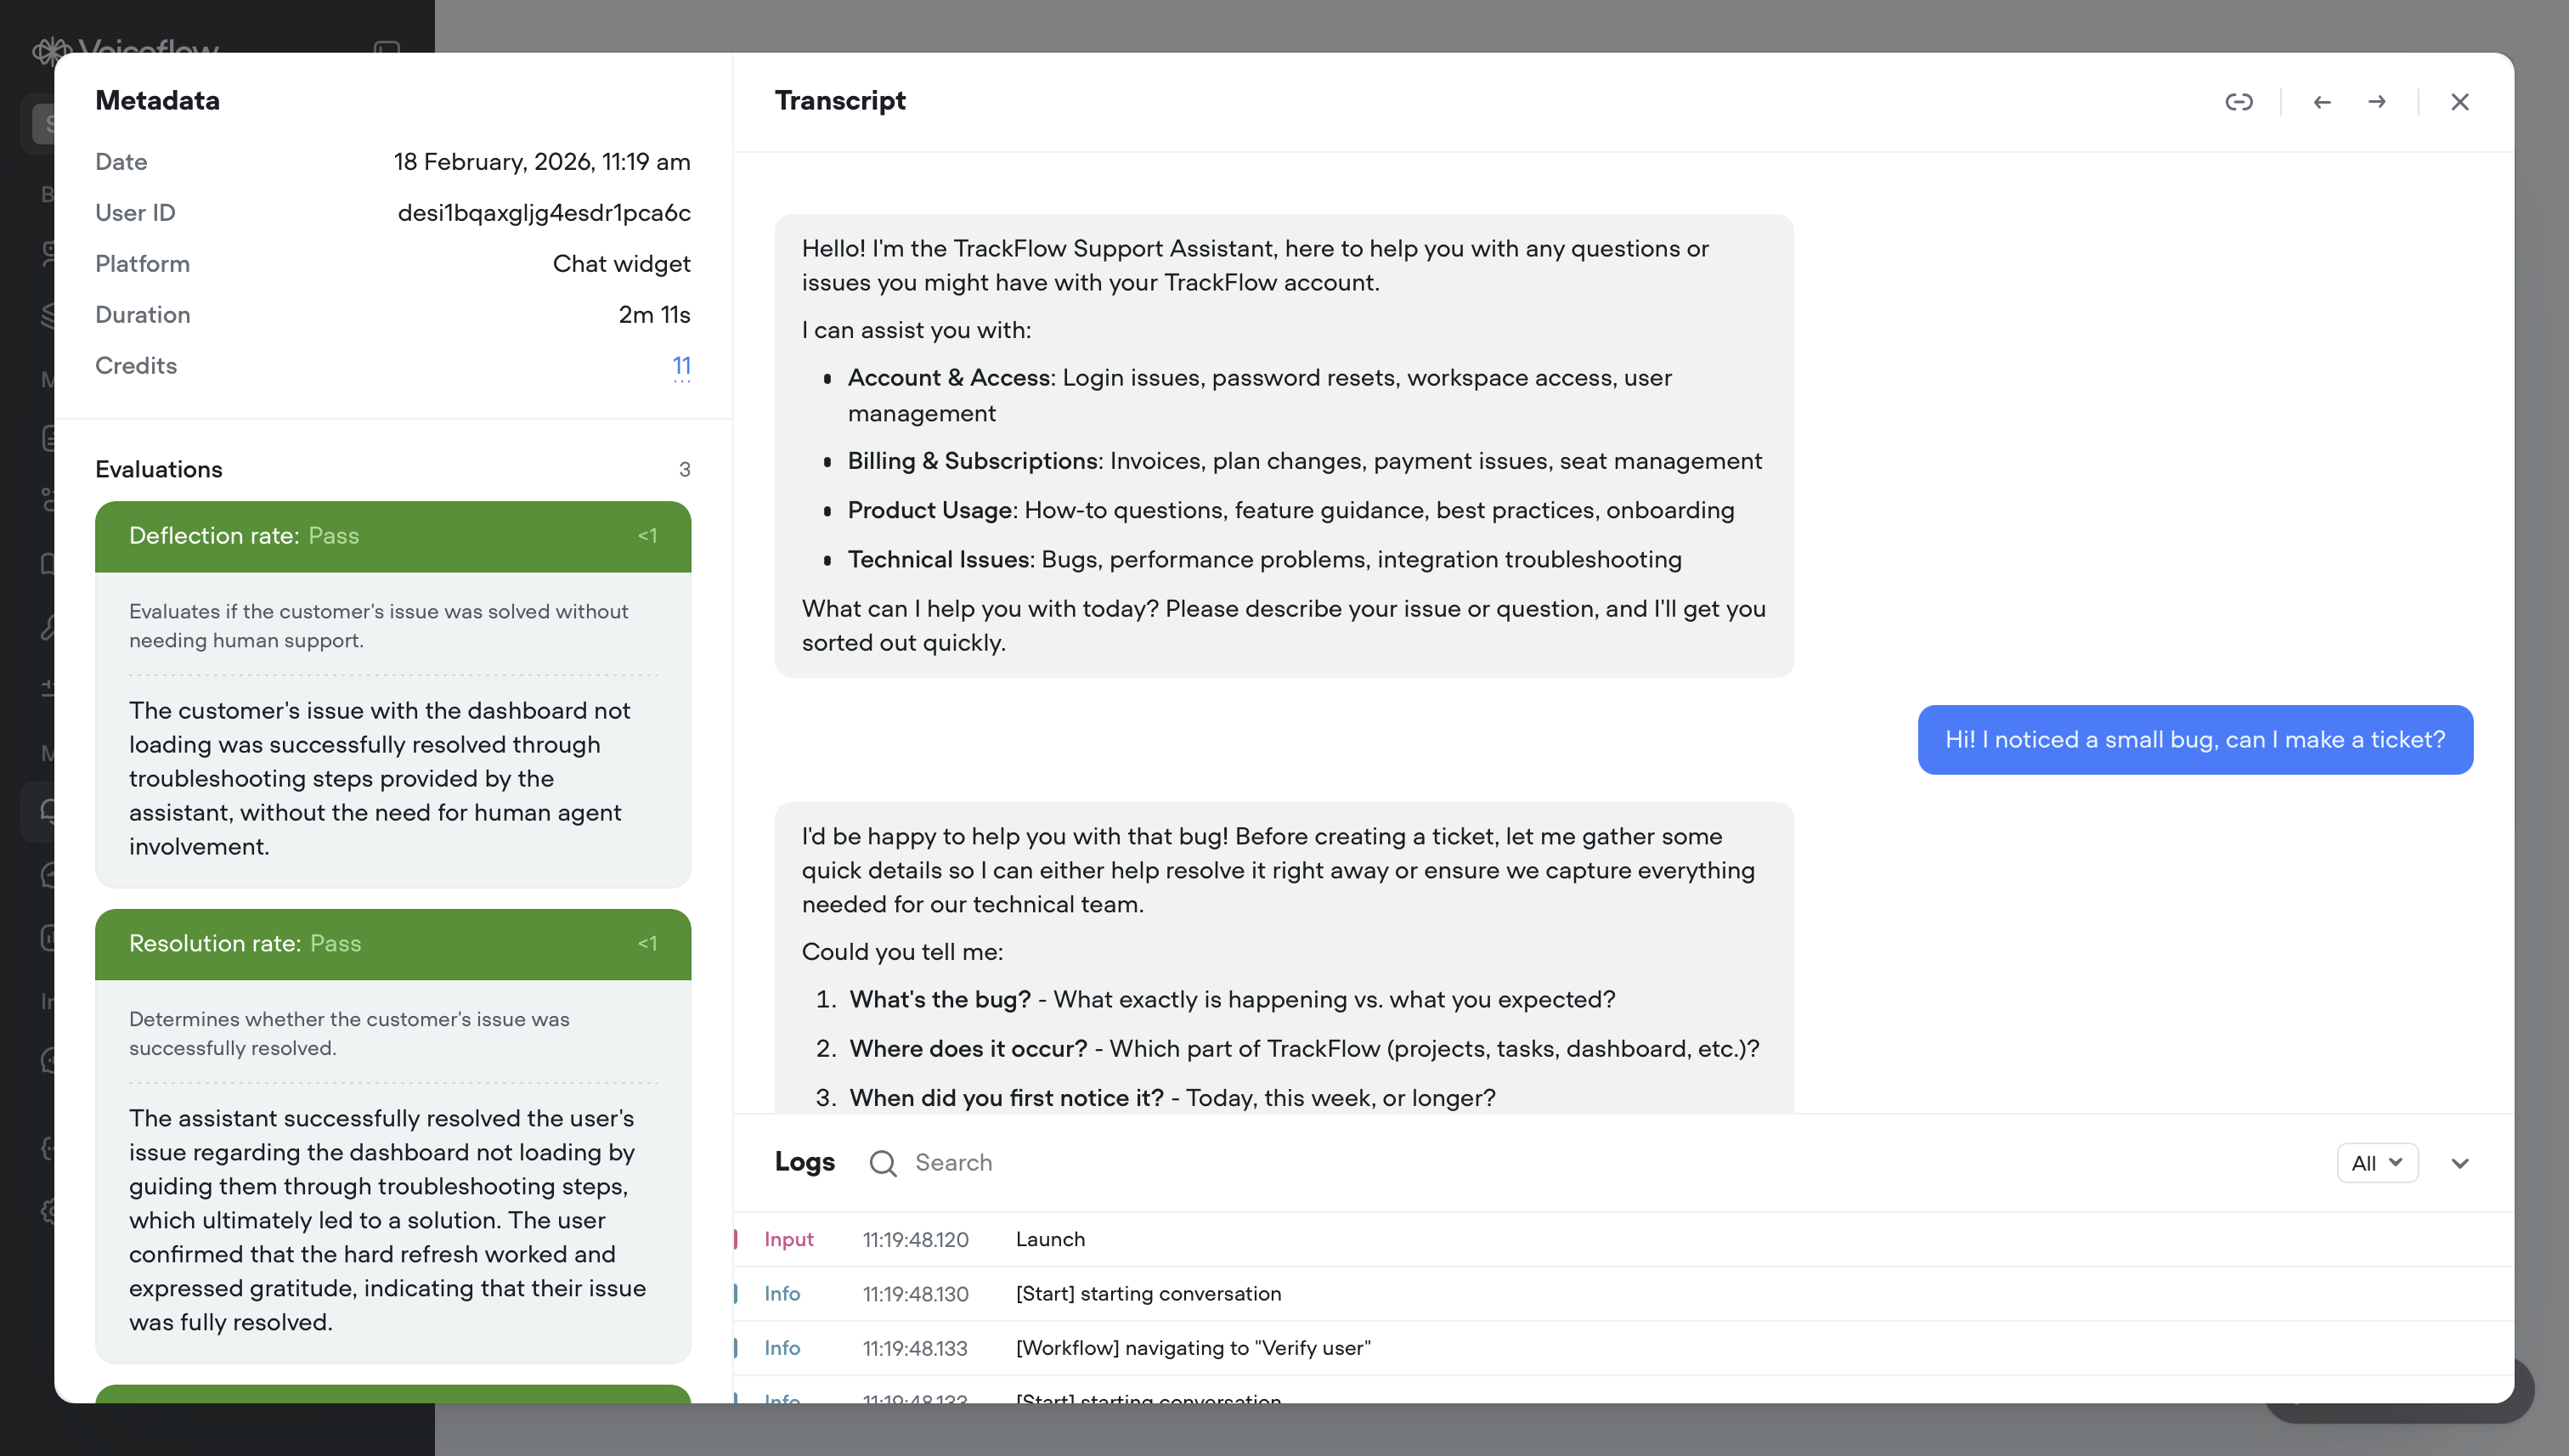
Attaching custom properties
Properties let you attach custom metadata to transcripts from within your workflows. Unlike variables, properties aren’t used during the conversation. They’re saved to the transcript for later filtering and analysis. For example, you might set properties for the customer’s plan tier, the topic of their inquiry, or whether a sale was made. You can then filter transcripts by these properties to analyze specific segments of conversations. To set a property, use the Set step in a workflow and add the property under the Properties to set header. To manage available properties, click Manage properties in the transcripts view.Customizing the table view
Click the table settings icon to choose which columns appear in your transcripts table. You can add or remove default fields, evaluation results, and custom properties to build a view tailored to the metrics that matter most to your team.