> ## Documentation Index
> Fetch the complete documentation index at: https://docs.voiceflow.com/llms.txt
> Use this file to discover all available pages before exploring further.
# Analytics
> Track your agent's performance and usage with a customizable dashboard of key metrics.
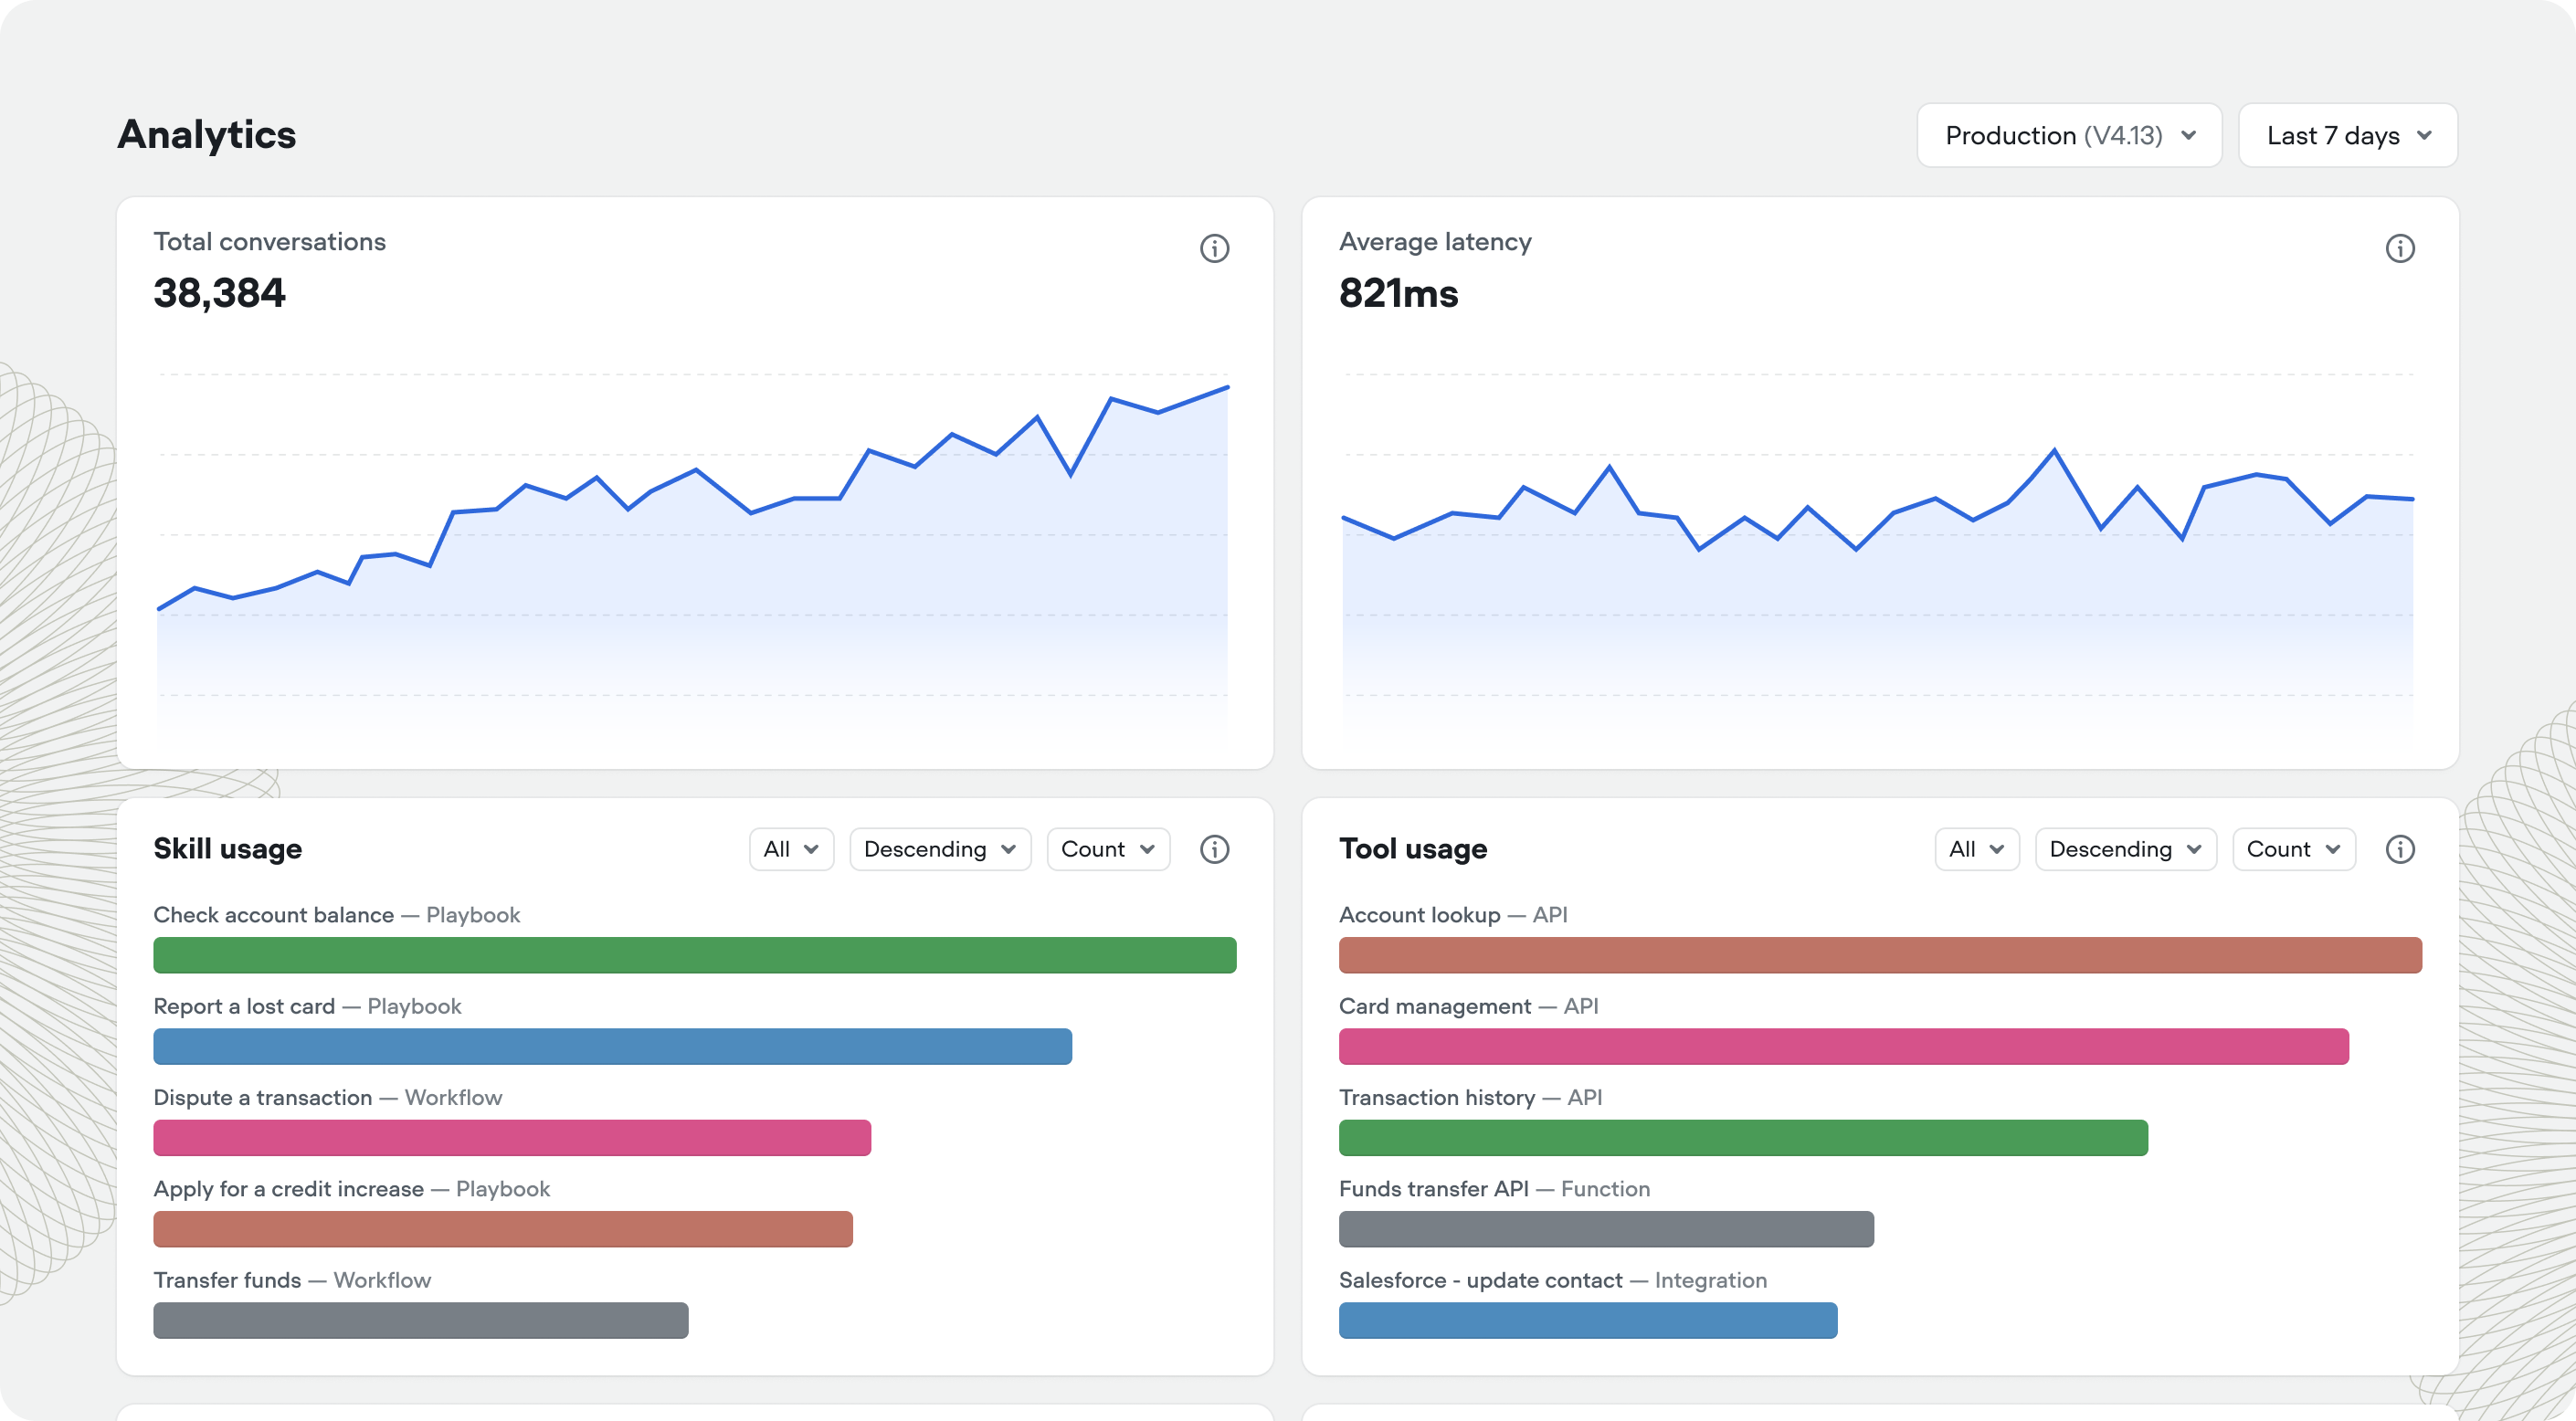 The Analytics dashboard gives you a high-level view of how your agent is performing across conversations. You can monitor evaluation results, usage patterns, costs, and operational metrics all in one place. Access the dashboard from the **Analytics** tab in the sidebar.
## Filtering your view
Use the controls at the top right to filter the data displayed across all widgets. The **Environment** dropdown lets you view metrics across all [environments](/documentation/deploy/environments) in the project or focus on a specific one. The **Date range** picker controls the time period for all charts and metrics.
## Customizing the dashboard
Click the settings icon to choose which widgets appear on your dashboard. Available metrics include:
* Resolution rate, Customer satisfaction, Deflection rate, and any other enabled [evaluations](/documentation/measure/evaluations)
* Total chats, Total interactions, and Unique users
* Latency monitoring and Credits usage
* Playbooks usage, Tools usage, and KB documents usage
Click **Reset to default** to restore the standard widget configuration. Hover over any metric's info icon for more detail about what it measures.
## Estimating business impact
The **Time saved** and **Dollars saved** widgets help you quantify the value your agent provides. Click **Add estimate** to configure how much time or money each automated conversation saves compared to manual handling. Once configured, the dashboard calculates your total savings based on conversation volume.
The Analytics dashboard gives you a high-level view of how your agent is performing across conversations. You can monitor evaluation results, usage patterns, costs, and operational metrics all in one place. Access the dashboard from the **Analytics** tab in the sidebar.
## Filtering your view
Use the controls at the top right to filter the data displayed across all widgets. The **Environment** dropdown lets you view metrics across all [environments](/documentation/deploy/environments) in the project or focus on a specific one. The **Date range** picker controls the time period for all charts and metrics.
## Customizing the dashboard
Click the settings icon to choose which widgets appear on your dashboard. Available metrics include:
* Resolution rate, Customer satisfaction, Deflection rate, and any other enabled [evaluations](/documentation/measure/evaluations)
* Total chats, Total interactions, and Unique users
* Latency monitoring and Credits usage
* Playbooks usage, Tools usage, and KB documents usage
Click **Reset to default** to restore the standard widget configuration. Hover over any metric's info icon for more detail about what it measures.
## Estimating business impact
The **Time saved** and **Dollars saved** widgets help you quantify the value your agent provides. Click **Add estimate** to configure how much time or money each automated conversation saves compared to manual handling. Once configured, the dashboard calculates your total savings based on conversation volume.